
The published SMA3 documents and the technical manual have defined the community/local impact metric as “institutional enrolment share in the population of the city (cities)/town(s) in which the institution is located” (MCTU, 2019, p. 24).
Mathematically this metric consists of institutional enrolment divided by community population and it functions like any other measure as far as target setting. In a paper commissioned by the C. D. Howe Institute, industry analyst Alex Usher decried,
The indicator for “community/local impact” is not a performance measure by any possible definition; rather, it is simply a reward for being located in a small community. As well, bizarre measurement difficulties seem certain to ensue for institutions with campuses in multiple communities.
(2019, p. 11)
The data source for the numerator in this ratio, university enrolment, is COU’s Common University Data Ontario (CUDO) enrolment data, there is no indication in the technical manual (MCTU, 2019) or SMAs about where the local population data are drawn from. The denominator, local population data, is potentially drawn from the Canadian census program’s data, last collected in 2016. As the CUDO enrolment data indicate that all university enrolments have grown since 2016 this would insulate institutions for target growth pressure from the denominator in this ratio; however, another census is to be conducted in 2021.
The metric is described as the university’s location, interpreted as the university’s primary campus or address.
Distance between the numerator and denominator
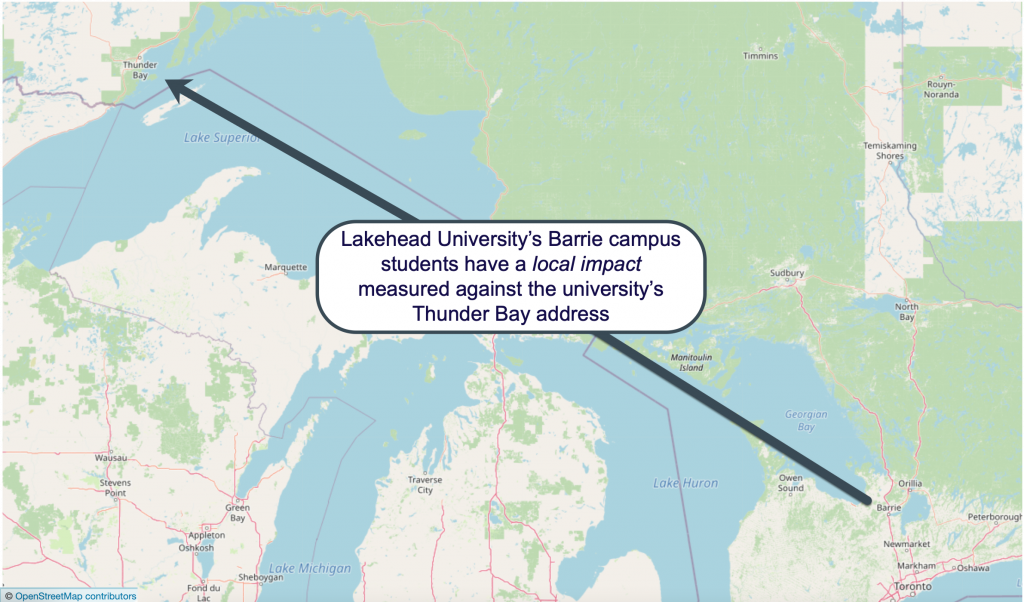
There appears to be no distinction made among enrolments that are associated with other locations or communities, or growth associated with these other locations and communities.
In theory, Lakehead University could see enrolments stagnate at its primary Thunder Bay campus, but report growth against its community/local impact metric from enrolments at Lakehead University’s Georgian campus in Barrie, a drive of 1,281 kilometres.
There is no other PBF program that uses this metric
This metric appears to be a measure of community growth or shrinkage, more than anything that the institution influences, and would appear to give an advantage to institutions in small or shrinking communities.
Institutions in larger or fast-growing communities will have to keep pace with these communities and will have less ability to influence this metric.
Outside of the tolerance margin, this metric can be interpreted as relative additional funding for rural/small community institutions presented as a performance metric.
While rural/small community institutions may justifiably deserve additional funding because of the related costs associated with operating outside of large urban centres, the comparative burden placed on urban institutions should not be overlooked.
Strategies to improve “performance”
Strategy 1: Grow enrollment year over year to match or exceed the local population growth
Strategy 2: Be located/relocate to a local population that is in decline
Strategy 3: Maintain enrollment levels, start a campaign to drive the local population to move elsewhere (Tactically: incentives, lottery, fear & intimidation?)
Implementation of the community/local impact metric
| University | 2020-21 | 2021-22 | 2022-23 | 2023-24 | 2024-25 |
|---|---|---|---|---|---|
| Algoma University | 15% | 5% | 5% | 5% | 5% |
| Brock University | 35% | 30% | 25% | 25% | 25% |
| Carleton University | 16.7% | 11.1% | 10.6% | 10.6% | 10.6% |
| Lakehead University | 10% | 5% | 5% | 5% | 5% |
| Laurentian University | 23% | 15% | 15% | 15% | 15% |
| McMaster University | 15% | 25% | 25% | 25% | 25% |
| Nipissing University | 25% | 25% | 20% | 20% | 20% |
| OCADu | 30% | 25% | 25% | 25% | 25% |
| Queen's University | 30% | 30% | 25% | 25% | 25% |
| Ryerson University | 20% | 20% | 25% | 25% | 25% |
| Trent University | 35% | 30% | 25% | 25% | 25% |
| Université de Hearst | 25% | 5% | 5% | 5% | 5% |
| University of Guelph | 30% | 25% | 25% | 25% | 25% |
| University of Ottawa | 15% | 10% | 10% | 10% | 10% |
| University of Toronto | 15% | 10% | 10% | 10% | 10% |
| University of Waterloo | 15% | 10% | 10% | 10% | 10% |
| University of Windsor | 35% | 30% | 25% | 25% | 25% |
| OTU (UOIT) | 30% | 15% | 15% | 15% | 15% |
| Western University | 10% | 5% | 5% | 5% | 5% |
| Wilfrid Laurier University | 30% | 20% | 15% | 15% | 15% |
| York University | 20% | 15% | 15% | 15% | 15% |
Across the five years of SMA3 that the community/local impact metric the average weighting begins at 22% in the first year, 17% in the second year and 16% in all subsequent years. In the first year, the most often assigned weight is 15%, 30% in the second year (30% is the maximum value, four institutions), 25% in the subsequent years (the maximum value, seven institutions). Both Brock University and the University of Windsor assigned the maximum value to this metric each year, Queen’s University is only 5% less than the 35% in the first year but maximizes weighting in subsequent years.
The calculation of this metric puts institutions in large cities at a disadvantage because of the proportional imbalance between the numerator and the denominator.
OCAD University has the lowest percentage of the population as the smallest of the four universities located in Toronto, the largest city in Canada. OCAD University’s 2018–19 historical data indicated that its enrolment represented 0.24% of Toronto’s population, and OCAD University has 2020–21 performance target of 0.23%. The University of Waterloo has the largest proportion of students to its local population in Waterloo, with an average proportion of 50.07% and a 2020–21 allowable performance target of 49.770%.
| University | Total Enrollments in 2019 | Location | 2020–21 target | Average (calc) | 2020–21 Target (calc) | Band of Tolerance (calc) | Target Floor % (calc) |
|---|---|---|---|---|---|---|---|
| Algoma University | 954 | Sault Ste. Marie | 1.980% | 2.050% | 2.260% | 12.460% | 1.978% |
| Université de Hearst | 147 | Timmins | 4.970% | 5.370% | 5.480% | 9.185% | 5.020% |
| Trent University | 8711 | Peterborough | 14.360% | 14.457% | 15.087% | 4.850% | 14.355% |
| Queen's University | 25535 | Kingston | 34.480% | 34.700% | 36.070% | 4.430% | 34.472% |
| Wilfrid Laurier University | 16459 | Waterloo | 19.220% | 19.567% | 20.087% | 4.346% | 19.214% |
| Nipissing University | 3565 | Nipissing University | 13.800% | 13.863% | 14.413% | 4.198% | 13.808% |
| McMaster University | 31901 | Hamitlon | 8.380% | 8.460% | 8.660% | 3.299% | 8.374% |
| York University | 47397 | Toronto | 2.780% | 2.810% | 2.870% | 3.249% | 2.777% |
| Average | 12.49% | 12.58% | 12.88% | 3.20% | 12.49% | ||
| University of Waterloo | 37088 | Waterloo | 49.770% | 50.007% | 51.187% | 2.772% | 49.768% |
| University of Windsor | 14506 | Windsor | 11.040% | 11.103% | 11.313% | 2.367% | 11.046% |
| Laurentian University | 6727 | Sudbury | 8.390% | 8.437% | 8.587% | 2.223% | 8.396% |
| Carleton University | 25242 | Ottawa | 4.800% | 4.843% | 4.903% | 2.096% | 4.801% |
| Lakehead University | 7140 | Thunder Bay | 8.380% | 8.380% | 8.530% | 1.795% | 8.377% |
| University of Ottawa | 37318 | Ottawa | 6.660% | 6.690% | 6.770% | 1.579% | 6.663% |
| Ryerson University | 31236 | Toronto | 2.280% | 2.300% | 2.320% | 1.539% | 2.284% |
| Western University | 36375 | London | 14.920% | 14.943% | 15.123% | 1.347% | 14.920% |
| University of Toronto | 83554 | Toronto | 3.760% | 3.770% | 3.820% | 1.335% | 3.769% |
| University of Guelph | 26804 | Guelph | 22.110% | 22.140% | 22.370% | 1.182% | 22.106% |
| Brock University | 16357 | St. Catharines | 20.380% | 20.433% | 20.593% | 1.033% | 20.381% |
| OCADu | 3402 | Toronto | 0.230% | 0.240% | 0.240% | 1.000% | 0.240% |
| OTU (UOIT) | 9417 | Oshawa | 9.600% | 9.627% | 9.697% | 1.000% | 9.600% |
Institutional narratives
Institutional narratives typically lauded connections to localities and celebrated contributions and collaborations. Many explained the physical footprint that the university has beyond its primary campus/address.
Nipissing University and the University of Windsor noted that they are significant employers in the region, in the case of Windsor the largest employer.
OCAD University sought to redefine community impact: “OCAD University defines Community and Local impact in broad terms: As a city-builder working closely with its culture and design sector neighbours, OCAD University provides the larger community cultural and economic resources through its galleries and public facilities” (OCAD & MCU, 2020, p. 15). Brock University, Laurentian University, and Western University noted the percentage of students that were drawn from the local region as well as those from outside of it, drawing attention to the economic impact of attracting students from other regions.
Ontario College of Art and Design (OCAD) University, and Ontario Ministry of Colleges and Universities. “2020-2025 Strategic Mandate Agreement: Ontario College of Arts and Design (OCAD) University [PDF],” 2020. https://www.ocadu.ca/sites/default/files/assets/files/OCAD%20University%20Strategic%20Mandate%20Agreement%2C%202020-2025.pdf.
Ontario Ministry of Training, Colleges and Universities. “Ontario’s Postsecondary Education System Performance/Outcomes Based Funding – Technical Manual.” Ontario Ministry of Training, Colleges and Universities, September 2019. http://www.uwindsor.ca/strategic-mandate-agreement/sites/uwindsor.ca.strategic-mandate-agreement/files/performance_outcomes-based_funding_technical_manual_-_v1.0_-_final_september_419_en.pdf.
Usher, Alex. “Funding for Results in Higher Education.” SSRN Scholarly Paper. Rochester, NY: Social Science Research Network, September 17, 2019. https://doi.org/10.2139/ssrn.3457526.
")


