In the SM2 Dashboard I created, slide five contains what each university had identified as their Program areas of Strength and reflected their rank (deliberate or otherwise) in each university’s SMA document. Slide six added to that with Program areas of expansion. That exercise appeared to be much more about the identification of differentiation than operationalizing it.
Where SMA2 asked institutions to nominate metrics and measures as part of strength-based differentiation, SMA3 asks institutions to nominate a subject area based on institutional strength and focus and also requires a system-wide measure, the “proportion of enrolment (FTEs, domestic and international) in an institution’s program area(s) of strength” as reported in the University Statistical Enrolment Report (USER).
Weingarten and Deller’s roadmap’s principles of differentiation were reflected in the proliferation of institutionally-specific metrics in SMA2, but not in their linking to funding decisions. SMA2’s institutional metrics’ had a comparative lack of significance for funding, with over 20 system-wide metrics representing only 4% of funding.
Many metrics contained within the 21 university SMA2s could not be measured by any party other than the institution itself (measures such as the actual values of the baselines that the targets were relative to, or wholly internal measures) or have outcomes compared to peer institutions’.
SMA3’s single Institutional Strength/Focus metric offers a clear, teaching-related differentiation that in the final years of SMA3 can represent as much as 25% of the 60% of performance-based funds an institution receives (as much as 15% overall). In SMA3 all institutions nominate their own area of strength, but the USER data source and proportion of enrollment measure are consistent.
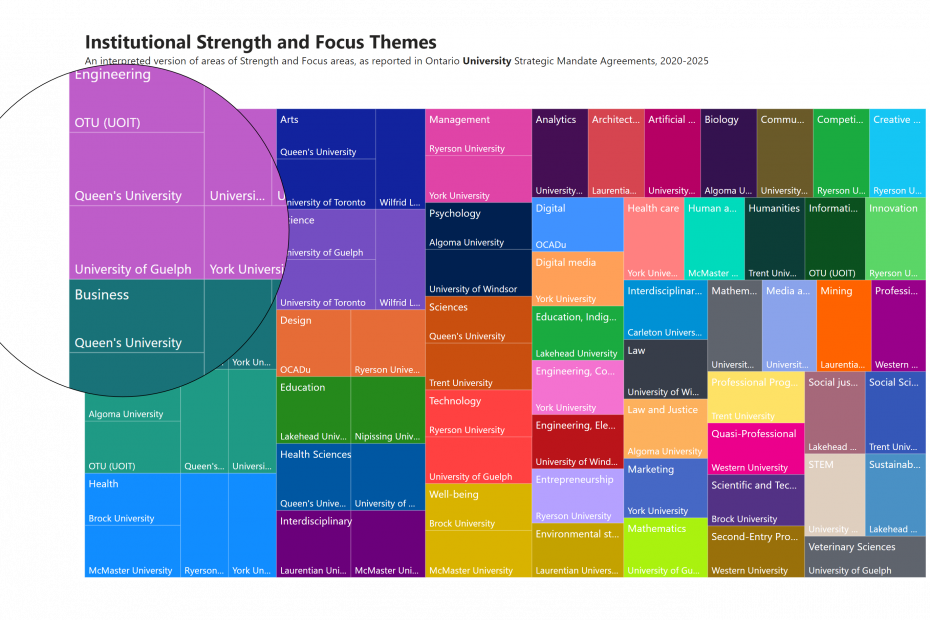
For thematic comparative purposes, the statements used in SMA3 versus the Program areas of strength and Program areas of expansion used in SMA2 don’t make for the same visual analysis of what clusters of program strengths exist in Ontario – and that’s not a bad thing. With SMA3’s ideas of growth, expansion and strength being tied to a formula that extends across all metrics, not a nominated program or groups of programs, this comparison does not offer the same system-wide insight into stated intent that the SMA2 growth comparison offered.
This dashboard offers a themetized comparison of each university’s statement. Full statements are in the table below.
The other difference between SMA2 and SMA3 on the topic of strengths is the apparent strategic decisions involved in nominating an Institutional Strength/Focus. There’s an incentive to nominate a statistical strength that will meet annual targets, not one that reflects a genuine strength. With SMA2, strengths were just a list.
| University | Strength-Name | 3 Year Average | 2020–21 Allowable performance target |
|---|---|---|---|
| OCADu | Design and digital | 54.60% | 51.79% |
| Laurentian University | Diverse portfolio of programs in mining, environmental stewardship, architecture and other interdisciplinary programs representing areas of enrolment stability or growth | 48.61% | 50.68% |
| Wilfrid Laurier University | Strength and Focus in Arts and Sciences Programs | 53.00% | 50.45% |
| McMaster University | Leveraging our strengths to advance human and societal health and well-being through interdisciplinary learning | 51.57% | 50.42% |
| Ryerson University | Innovation and Entrepreneurship; Design and Technology; Management and Competitiveness; Creative Economy and Culture; and Health and Technology | 51.38% | 49.92% |
| York University | Program areas of strength and growth in computer and information sciences and support services; Engineering and computer engineering; Digital media; Business, management, marketing and related support services; Health and health care | 49.25% | 49.22% |
| Brock University | Health and Well-being through the Lifespan and Scientific and Technological Applications | 48.74% | 49.18% |
| Carleton University | Interdisciplinary Programs | 44.92% | 45.21% |
| Western University | Professional, Quasi-Professional, and Second-Entry Programs | 45.87% | 44.66% |
| University of Toronto | Full-Time Enrolment in Broad Arts & Science Disciplines, including Emerging Data Science Fields | 41.44% | 41.00% |
| Queen's University | Enrolment in Engineering, Computer Science, Business, Arts and Sciences, including Health Sciences | 43.49% | 40.62% |
| University of Guelph | Science, Technology, Engineering and Math (STEM) and Veterinary Sciences | 40.34% | 40.56% |
| University of Waterloo | Engineering, Mathematics and Computer Science | 41.55% | 40.12% |
| OTU (UOIT) | Enrolment in Engineering, Computer Science, and Information Technology Disciplines | 34.10% | 34.07% |
| Université de Hearst | Ratio of students enrolled in the business administration program (BAA) | 31.75% | 33.78% |
| Algoma University | Biology, Computer Science, Law and Justice, Psychology | 36.90% | 33.04% |
| University of Windsor | Institutional Strength and Focus: Business, Communication, Media and Film, Electrical Engineering, Health Sciences, Law, and Psychology | 33.71% | 32.65% |
| Lakehead University | Sustainability, social justice and Indigenous education | 25.68% | 26.09% |
| Nipissing University | Proportion of students enrolled in Education programs (i.e., FORPOS 139, 142, 190, 273 and 439) | 17.56% | 19.83% |
| Trent University | Humanities, Sciences, Social Sciences and Professional Programs | 17.80% | 19.68% |
| University of Ottawa | Analytics and Artificial Intelligence | 9.26% | 9.21% |
")


