Not only does the 2020-2025 Strategic Mandate Agreement (SMA3) governing Ontario Universities’ provincial funding have performance-based metrics, with two metrics nominated by each university, the metrics are also weighted by each university.
Weights across the 10 metrics are to be between 5% and 25% in 2022-23, weights can be up to 35% in 2020-21 and 2021-21 as the number of activated metrics increases over the first two years, but because of COVID-19 funding will not be attached to the performance metrics of SMA3 until 2022-23. More details in this response to their initial posting.
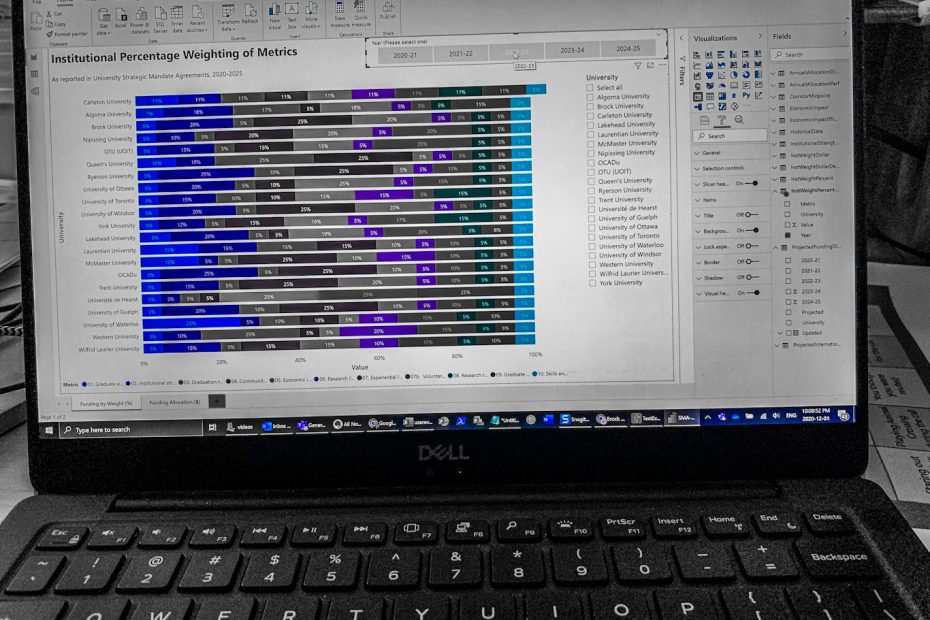
Institutional Percentage Weighting of Metrics


Institutional Notional Funding Allocation of Metrics


All Ontario University SMA3 metrics weights.csv
| University | Metric | 2020-21 | 2021-22 | 2022-23 | 2023-24 | 2024-25 |
|---|---|---|---|---|---|---|
| Algoma University | 01. Graduate employment rate in a related field | 20% | 12% | 7% | 7% | 7% |
| Algoma University | 02. Institutional strength and focus | 20% | 18% | 18% | 18% | 18% |
| Algoma University | 03. Graduation rate | 15% | 17% | 17% | 17% | 17% |
| Algoma University | 04. Community and local impact of student enrolment | 15% | 5% | 5% | 5% | 5% |
| Algoma University | 05. Economic impact (institution-specific) | 20% | 18% | 18% | 18% | 18% |
| Algoma University | 06. Research funding and capacity: federal tri-agency funding secured | 10% | 5% | 5% | 5% | 5% |
| Algoma University | 07. Experiential learning | 0% | 5% | 5% | 5% | 5% |
| Algoma University | 08. Research revenue attracted from private sector sources | 0% | 5% | 5% | 5% | 5% |
| Algoma University | 09. Graduate employment earnings | 0.0% | 15.0% | 15.0% | 15.0% | 15.0% |
| Algoma University | 10. Skills and competencies | 0% | 0% | 5% | 5% | 5% |
| Brock University | 01. Graduate employment rate in a related field | 10% | 5% | 5% | 5% | 5% |
| Brock University | 02. Institutional strength and focus | 20% | 20% | 20% | 20% | 20% |
| Brock University | 03. Graduation rate | 10% | 5% | 5% | 5% | 5% |
| Brock University | 04. Community and local impact of student enrolment | 35% | 30% | 25% | 25% | 25% |
| Brock University | 05. Economic impact (institution-specific) | 15% | 20% | 20% | 20% | 20% |
| Brock University | 06. Research funding and capacity: federal tri-agency funding secured | 10% | 5% | 5% | 5% | 5% |
| Brock University | 07. Experiential learning | 0% | 5% | 5% | 5% | 5% |
| Brock University | 08. Research revenue attracted from private sector sources | 0% | 5% | 5% | 5% | 5% |
| Brock University | 09. Graduate employment earnings | 0.0% | 5.0% | 5.0% | 5.0% | 5.0% |
| Brock University | 10. Skills and competencies | 0% | 0% | 5% | 5% | 5% |
| Carleton University | 01. Graduate employment rate in a related field | 16.7% | 11.1% | 10.6% | 10.6% | 10.6% |
| Carleton University | 02. Institutional strength and focus | 16.7% | 11.1% | 10.6% | 10.6% | 10.6% |
| Carleton University | 03. Graduation rate | 16.7% | 11.1% | 10.6% | 10.6% | 10.6% |
| Carleton University | 04. Community and local impact of student enrolment | 16.7% | 11.1% | 10.6% | 10.6% | 10.6% |
| Carleton University | 05. Economic impact (institution-specific) | 16.7% | 11.1% | 10.6% | 10.6% | 10.6% |
| Carleton University | 06. Research funding and capacity: federal tri-agency funding secured | 16.7% | 11.1% | 10.6% | 10.6% | 10.6% |
| Carleton University | 07. Experiential learning | 0.0% | 11.1% | 10.6% | 10.6% | 10.6% |
| Carleton University | 08. Research revenue attracted from private sector sources | 0.0% | 11.1% | 10.6% | 10.6% | 10.6% |
| Carleton University | 09. Graduate employment earnings | 0.0% | 11.1% | 10.6% | 10.6% | 10.6% |
| Carleton University | 10. Skills and competencies | 0.0% | 0.0% | 5.0% | 5.0% | 5.0% |
| Lakehead University | 01. Graduate employment rate in a related field | 15% | 8% | 8% | 8% | 8% |
| Lakehead University | 02. Institutional strength and focus | 20% | 20% | 20% | 20% | 20% |
| Lakehead University | 03. Graduation rate | 10% | 5% | 5% | 5% | 5% |
| Lakehead University | 04. Community and local impact of student enrolment | 10% | 5% | 5% | 5% | 5% |
| Lakehead University | 05. Economic impact (institution-specific) | 35% | 24% | 19% | 19% | 19% |
| Lakehead University | 06. Research funding and capacity: federal tri-agency funding secured | 10% | 5% | 5% | 5% | 5% |
| Lakehead University | 07. Experiential learning | 0% | 20% | 20% | 20% | 20% |
| Lakehead University | 08. Research revenue attracted from private sector sources | 0% | 5% | 5% | 5% | 5% |
| Lakehead University | 09. Graduate employment earnings | 0.0% | 8.0% | 8.0% | 5.0% | 8.0% |
| Lakehead University | 10. Skills and competencies | 0% | 0% | 5% | 5% | 5% |
| Laurentian University | 01. Graduate employment rate in a related field | 10% | 15% | 15% | 15% | 15% |
| Laurentian University | 02. Institutional strength and focus | 24% | 15% | 15% | 15% | 15% |
| Laurentian University | 03. Graduation rate | 23% | 15% | 15% | 15% | 15% |
| Laurentian University | 04. Community and local impact of student enrolment | 23% | 15% | 15% | 15% | 15% |
| Laurentian University | 05. Economic impact (institution-specific) | 10% | 15% | 10% | 10% | 10% |
| Laurentian University | 06. Research funding and capacity: federal tri-agency funding secured | 10% | 5% | 5% | 5% | 5% |
| Laurentian University | 07. Experiential learning | 0% | 10% | 10% | 10% | 10% |
| Laurentian University | 08. Research revenue attracted from private sector sources | 0% | 5% | 5% | 5% | 5% |
| Laurentian University | 09. Graduate employment earnings | 0.0% | 5.0% | 5.0% | 5.0% | 5.0% |
| Laurentian University | 10. Skills and competencies | 0% | 0% | 5% | 5% | 5% |
| McMaster University | 01. Graduate employment rate in a related field | 15% | 15% | 15% | 15% | 15% |
| McMaster University | 02. Institutional strength and focus | 10% | 5% | 5% | 5% | 5% |
| McMaster University | 03. Graduation rate | 20% | 5% | 5% | 5% | 5% |
| McMaster University | 04. Community and local impact of student enrolment | 15% | 25% | 25% | 25% | 25% |
| McMaster University | 05. Economic impact (institution-specific) | 25% | 10% | 10% | 10% | 10% |
| McMaster University | 06. Research funding and capacity: federal tri-agency funding secured | 15% | 15% | 15% | 15% | 15% |
| McMaster University | 07. Experiential learning | 0% | 10% | 10% | 10% | 10% |
| McMaster University | 08. Research revenue attracted from private sector sources | 0% | 10% | 5% | 5% | 5% |
| McMaster University | 09. Graduate employment earnings | 0.0% | 5.0% | 5.0% | 5.0% | 5.0% |
| McMaster University | 10. Skills and competencies | 0% | 0% | 5% | 5% | 5% |
| Nipissing University | 01. Graduate employment rate in a related field | 10% | 5% | 5% | 5% | 5% |
| Nipissing University | 02. Institutional strength and focus | 35% | 30% | 10% | 10% | 10% |
| Nipissing University | 03. Graduation rate | 10% | 5% | 5% | 5% | 5% |
| Nipissing University | 04. Community and local impact of student enrolment | 25% | 25% | 20% | 20% | 20% |
| Nipissing University | 05. Economic impact (institution-specific) | 10% | 10% | 20% | 20% | 20% |
| Nipissing University | 06. Research funding and capacity: federal tri-agency funding secured | 10% | 5% | 5% | 5% | 5% |
| Nipissing University | 07. Experiential learning | 0% | 10% | 20% | 20% | 20% |
| Nipissing University | 08. Research revenue attracted from private sector sources | 0% | 5% | 5% | 5% | 5% |
| Nipissing University | 09. Graduate employment earnings | 0.0% | 5.0% | 5.0% | 5.0% | 5.0% |
| Nipissing University | 10. Skills and competencies | 0% | 0% | 5% | 5% | 5% |
| OCADu | 01. Graduate employment rate in a related field | 10% | 10% | 5% | 5% | 5% |
| OCADu | 02. Institutional strength and focus | 30% | 25% | 25% | 25% | 25% |
| OCADu | 03. Graduation rate | 10% | 5% | 5% | 5% | 5% |
| OCADu | 04. Community and local impact of student enrolment | 30% | 25% | 25% | 25% | 25% |
| OCADu | 05. Economic impact (institution-specific) | 10% | 10% | 10% | 10% | 9% |
| OCADu | 06. Research funding and capacity: federal tri-agency funding secured | 10% | 5% | 5% | 5% | 5% |
| OCADu | 07. Experiential learning | 0% | 10% | 10% | 10% | 10% |
| OCADu | 08. Research revenue attracted from private sector sources | 0% | 5% | 5% | 5% | 6% |
| OCADu | 09. Graduate employment earnings | 0.0% | 5.0% | 5.0% | 5.0% | 5.0% |
| OCADu | 10. Skills and competencies | 0% | 0% | 5% | 5% | 5% |
| Queen's University | 01. Graduate employment rate in a related field | 15% | 15% | 10% | 10% | 10% |
| Queen's University | 02. Institutional strength and focus | 15% | 10% | 10% | 10% | 10% |
| Queen's University | 03. Graduation rate | 20% | 20% | 25% | 25% | 25% |
| Queen's University | 04. Community and local impact of student enrolment | 30% | 30% | 25% | 25% | 25% |
| Queen's University | 05. Economic impact (institution-specific) | 10% | 5% | 5% | 5% | 5% |
| Queen's University | 06. Research funding and capacity: federal tri-agency funding secured | 10% | 5% | 5% | 5% | 5% |
| Queen's University | 07. Experiential learning | 0% | 5% | 5% | 5% | 5% |
| Queen's University | 08. Research revenue attracted from private sector sources | 0% | 5% | 5% | 5% | 5% |
| Queen's University | 09. Graduate employment earnings | 0.0% | 5.0% | 5.0% | 5.0% | 5.0% |
| Queen's University | 10. Skills and competencies | 0% | 0% | 5% | 5% | 5% |
| Ryerson University | 01. Graduate employment rate in a related field | 10% | 5% | 5% | 5% | 5% |
| Ryerson University | 02. Institutional strength and focus | 30% | 30% | 25% | 25% | 25% |
| Ryerson University | 03. Graduation rate | 20% | 10% | 10% | 10% | 10% |
| Ryerson University | 04. Community and local impact of student enrolment | 20% | 20% | 25% | 25% | 25% |
| Ryerson University | 05. Economic impact (institution-specific) | 10% | 10% | 5% | 5% | 5% |
| Ryerson University | 06. Research funding and capacity: federal tri-agency funding secured | 10% | 5% | 5% | 5% | 5% |
| Ryerson University | 07. Experiential learning | 0% | 10% | 10% | 10% | 10% |
| Ryerson University | 08. Research revenue attracted from private sector sources | 0% | 5% | 5% | 5% | 5% |
| Ryerson University | 09. Graduate employment earnings | 0.0% | 5.0% | 5.0% | 5.0% | 5.0% |
| Ryerson University | 10. Skills and competencies | 0% | 0% | 5% | 5% | 5% |
| Trent University | 01. Graduate employment rate in a related field | 10% | 5% | 5% | 5% | 5% |
| Trent University | 02. Institutional strength and focus | 15% | 15% | 15% | 15% | 15% |
| Trent University | 03. Graduation rate | 10% | 5% | 5% | 5% | 5% |
| Trent University | 04. Community and local impact of student enrolment | 35% | 30% | 25% | 25% | 25% |
| Trent University | 05. Economic impact (institution-specific) | 20% | 25% | 20% | 20% | 20% |
| Trent University | 06. Research funding and capacity: federal tri-agency funding secured | 10% | 5% | 5% | 5% | 5% |
| Trent University | 07. Experiential learning | 0% | 5% | 10% | 10% | 10% |
| Trent University | 08. Research revenue attracted from private sector sources | 0% | 5% | 5% | 5% | 5% |
| Trent University | 09. Graduate employment earnings | 0.0% | 5.0% | 5.0% | 5.0% | 5.0% |
| Trent University | 10. Skills and competencies | 0% | 0% | 5% | 5% | 5% |
| Université de Hearst | 01. Graduate employment rate in a related field | 10% | 5% | 5% | 5% | 5% |
| Université de Hearst | 02. Institutional strength and focus | 20% | 5% | 5% | 5% | 5% |
| Université de Hearst | 03. Graduation rate | 10% | 5% | 5% | 5% | 5% |
| Université de Hearst | 04. Community and local impact of student enrolment | 25% | 5% | 5% | 5% | 5% |
| Université de Hearst | 05. Economic impact (institution-specific) | 35% | 25% | 25% | 25% | 25% |
| Université de Hearst | 06. Research funding and capacity: federal tri-agency funding secured | 0% | 0% | 0% | 0% | 0% |
| Université de Hearst | 07. Experiential learning | 0% | 30% | 25% | 25% | 25% |
| Université de Hearst | 07b. Voluntary enrolment in Volet professionnel | 0% | 25% | 25% | 25% | 25% |
| Université de Hearst | 08. Research revenue attracted from private sector sources | 0% | 0% | 0% | 0% | 0% |
| Université de Hearst | 09. Graduate employment earnings | 0.0% | 0.0% | 0.0% | 0.0% | 0.0% |
| Université de Hearst | 10. Skills and competencies | 0% | 0% | 5% | 5% | 5% |
| University of Guelph | 01. Graduate employment rate in a related field | 10% | 5% | 5% | 5% | 5% |
| University of Guelph | 02. Institutional strength and focus | 30% | 25% | 20% | 20% | 20% |
| University of Guelph | 03. Graduation rate | 10% | 10% | 10% | 10% | 10% |
| University of Guelph | 04. Community and local impact of student enrolment | 30% | 25% | 25% | 25% | 25% |
| University of Guelph | 05. Economic impact (institution-specific) | 10% | 10% | 10% | 10% | 10% |
| University of Guelph | 06. Research funding and capacity: federal tri-agency funding secured | 10% | 5% | 5% | 5% | 5% |
| University of Guelph | 07. Experiential learning | 0% | 10% | 10% | 10% | 10% |
| University of Guelph | 08. Research revenue attracted from private sector sources | 0% | 5% | 5% | 5% | 5% |
| University of Guelph | 09. Graduate employment earnings | 0.0% | 5.0% | 5.0% | 5.0% | 5.0% |
| University of Guelph | 10. Skills and competencies | 0% | 0% | 5% | 5% | 5% |
| University of Ottawa | 01. Graduate employment rate in a related field | 10% | 5% | 5% | 5% | 5% |
| University of Ottawa | 02. Institutional strength and focus | 20% | 20% | 20% | 20% | 20% |
| University of Ottawa | 03. Graduation rate | 15% | 5% | 5% | 5% | 5% |
| University of Ottawa | 04. Community and local impact of student enrolment | 15% | 10% | 10% | 10% | 10% |
| University of Ottawa | 05. Economic impact (institution-specific) | 25% | 25% | 25% | 25% | 25% |
| University of Ottawa | 06. Research funding and capacity: federal tri-agency funding secured | 15% | 5% | 5% | 5% | 5% |
| University of Ottawa | 07. Experiential learning | 0% | 20% | 15% | 15% | 15% |
| University of Ottawa | 08. Research revenue attracted from private sector sources | 0% | 5% | 5% | 5% | 5% |
| University of Ottawa | 09. Graduate employment earnings | 0.0% | 5.0% | 5.0% | 5.0% | 5.0% |
| University of Ottawa | 10. Skills and competencies | 0% | 0% | 5% | 5% | 5% |
| University of Toronto | 01. Graduate employment rate in a related field | 10% | 5% | 5% | 5% | 5% |
| University of Toronto | 02. Institutional strength and focus | 15% | 15% | 15% | 15% | 15% |
| University of Toronto | 03. Graduation rate | 15% | 10% | 10% | 10% | 10% |
| University of Toronto | 04. Community and local impact of student enrolment | 15% | 10% | 10% | 10% | 10% |
| University of Toronto | 05. Economic impact (institution-specific) | 20% | 15% | 15% | 15% | 15% |
| University of Toronto | 06. Research funding and capacity: federal tri-agency funding secured | 25% | 20% | 15% | 15% | 15% |
| University of Toronto | 07. Experiential learning | 0% | 5% | 5% | 5% | 5% |
| University of Toronto | 08. Research revenue attracted from private sector sources | 0% | 15% | 15% | 15% | 15% |
| University of Toronto | 09. Graduate employment earnings | 0.0% | 5.0% | 5.0% | 5.0% | 5.0% |
| University of Toronto | 10. Skills and competencies | 0% | 0% | 5% | 5% | 5% |
| University of Waterloo | 01. Graduate employment rate in a related field | 30% | 25% | 25% | 25% | 25% |
| University of Waterloo | 02. Institutional strength and focus | 10% | 5% | 5% | 5% | 5% |
| University of Waterloo | 03. Graduation rate | 15% | 10% | 10% | 10% | 10% |
| University of Waterloo | 04. Community and local impact of student enrolment | 15% | 10% | 10% | 10% | 10% |
| University of Waterloo | 05. Economic impact (institution-specific) | 15% | 5% | 5% | 5% | 5% |
| University of Waterloo | 06. Research funding and capacity: federal tri-agency funding secured | 15% | 10% | 10% | 10% | 10% |
| University of Waterloo | 07. Experiential learning | 0% | 15% | 15% | 15% | 15% |
| University of Waterloo | 08. Research revenue attracted from private sector sources | 0% | 5% | 5% | 5% | 5% |
| University of Waterloo | 09. Graduate employment earnings | 0.0% | 15.0% | 10.0% | 10.0% | 10.0% |
| University of Waterloo | 10. Skills and competencies | 0% | 0% | 5% | 5% | 5% |
| University of Windsor | 01. Graduate employment rate in a related field | 10% | 5% | 5% | 5% | 5% |
| University of Windsor | 02. Institutional strength and focus | 25% | 20% | 20% | 20% | 20% |
| University of Windsor | 03. Graduation rate | 10% | 5% | 5% | 5% | 5% |
| University of Windsor | 04. Community and local impact of student enrolment | 35% | 30% | 25% | 25% | 25% |
| University of Windsor | 05. Economic impact (institution-specific) | 10% | 20% | 20% | 20% | 20% |
| University of Windsor | 06. Research funding and capacity: federal tri-agency funding secured | 10% | 5% | 5% | 5% | 5% |
| University of Windsor | 07. Experiential learning | 0% | 5% | 5% | 5% | 5% |
| University of Windsor | 08. Research revenue attracted from private sector sources | 0% | 5% | 5% | 5% | 5% |
| University of Windsor | 09. Graduate employment earnings | 0.0% | 5.0% | 5.0% | 5.0% | 5.0% |
| University of Windsor | 10. Skills and competencies | 0% | 0% | 5% | 5% | 5% |
| OTU (UOIT) | 01. Graduate employment rate in a related field | 10% | 5% | 5% | 5% | 5% |
| OTU (UOIT) | 02. Institutional strength and focus | 30% | 15% | 15% | 15% | 15% |
| OTU (UOIT) | 03. Graduation rate | 10% | 5% | 5% | 5% | 5% |
| OTU (UOIT) | 04. Community and local impact of student enrolment | 30% | 15% | 15% | 15% | 15% |
| OTU (UOIT) | 05. Economic impact (institution-specific) | 10% | 15% | 15% | 15% | 15% |
| OTU (UOIT) | 06. Research funding and capacity: federal tri-agency funding secured | 10% | 5% | 5% | 5% | 5% |
| OTU (UOIT) | 07. Experiential learning | 0% | 30% | 25% | 25% | 25% |
| OTU (UOIT) | 08. Research revenue attracted from private sector sources | 0% | 5% | 5% | 5% | 5% |
| OTU (UOIT) | 09. Graduate employment earnings | 0.0% | 5.0% | 5.0% | 5.0% | 5.0% |
| OTU (UOIT) | 10. Skills and competencies | 0% | 0% | 5% | 5% | 5% |
| Western University | 01. Graduate employment rate in a related field | 10% | 5% | 5% | 5% | 5% |
| Western University | 02. Institutional strength and focus | 15% | 10% | 10% | 10% | 10% |
| Western University | 03. Graduation rate | 30% | 25% | 25% | 25% | 25% |
| Western University | 04. Community and local impact of student enrolment | 10% | 5% | 5% | 5% | 5% |
| Western University | 05. Economic impact (institution-specific) | 10% | 5% | 5% | 5% | 5% |
| Western University | 06. Research funding and capacity: federal tri-agency funding secured | 25% | 25% | 20% | 20% | 20% |
| Western University | 07. Experiential learning | 0% | 15% | 15% | 15% | 15% |
| Western University | 08. Research revenue attracted from private sector sources | 0% | 5% | 5% | 5% | 5% |
| Western University | 09. Graduate employment earnings | 0.0% | 5.0% | 5.0% | 5.0% | 5.0% |
| Western University | 10. Skills and competencies | 0% | 0% | 5% | 5% | 5% |
| Wilfrid Laurier University | 01. Graduate employment rate in a related field | 10% | 5% | 5% | 5% | 5% |
| Wilfrid Laurier University | 02. Institutional strength and focus | 20% | 15% | 15% | 15% | 15% |
| Wilfrid Laurier University | 03. Graduation rate | 10% | 5% | 5% | 5% | 5% |
| Wilfrid Laurier University | 04. Community and local impact of student enrolment | 30% | 20% | 15% | 15% | 15% |
| Wilfrid Laurier University | 05. Economic impact (institution-specific) | 15% | 15% | 15% | 15% | 15% |
| Wilfrid Laurier University | 06. Research funding and capacity: federal tri-agency funding secured | 15% | 10% | 10% | 10% | 10% |
| Wilfrid Laurier University | 07. Experiential learning | 0% | 15% | 15% | 15% | 15% |
| Wilfrid Laurier University | 08. Research revenue attracted from private sector sources | 0% | 5% | 5% | 5% | 5% |
| Wilfrid Laurier University | 09. Graduate employment earnings | 0.0% | 10.0% | 10.0% | 10.0% | 10.0% |
| Wilfrid Laurier University | 10. Skills and competencies | 0% | 0% | 5% | 5% | 5% |
| York University | 01. Graduate employment rate in a related field | 10% | 5% | 5% | 5% | 5% |
| York University | 02. Institutional strength and focus | 20% | 15% | 12% | 12% | 12% |
| York University | 03. Graduation rate | 10% | 5% | 5% | 5% | 5% |
| York University | 04. Community and local impact of student enrolment | 20% | 15% | 15% | 15% | 15% |
| York University | 05. Economic impact (institution-specific) | 30% | 17% | 16% | 16% | 16% |
| York University | 06. Research funding and capacity: federal tri-agency funding secured | 10% | 5% | 5% | 5% | 5% |
| York University | 07. Experiential learning | 0% | 18% | 17% | 17% | 17% |
| York University | 08. Research revenue attracted from private sector sources | 0% | 15% | 15% | 15% | 15% |
| York University | 09. Graduate employment earnings | 0.0% | 5.0% | 5.0% | 5.0% | 5.0% |
| York University | 10. Skills and competencies | 0% | 0% | 5% | 5% | 5% |
These weightings represent some interesting decisions by these institutions. What is not depicted here are the actual performance targets that each institution needs to hit, nor an indication of how much of a challenge that may or may not be.
This information is available as CSVs or as a PowerBI Project on GitHub.
")


