

This metric is active from the first year of SMA3 and measures an aggregate of the institution’s funding received from the three federal research granting agencies: Social Sciences and Humanities Research Council, Natural Sciences and Engineering Research Council, and the Canadian Institutes of Health Research—the Tri-Agencies.
The data are provided by the Tri-Agency Institutional Programs Secretariat. Funding received through this metric is to be part of the institution’s base funding or infrastructure funding, but it is tied to the competitive project-based funding from these national agencies.
The metric is measured as the percent of funds awarded in Ontario, as some of the similar institutionally nominated metrics were measured in SMA2.
Federal Tri-Agency funding secured was a standard metric in SMA2; however, the method of measuring was not standardized and varied between targets set in dollars awarded and targets set as percentages of Ontario’s total (leading to targets that collectively represented an impossible 104.63% share of the Ontario total for Canadian Institutes of Health Research and 103.72% of the Ontario total for Tri-Council funding).
The two research metrics, this one and Research revenue attracted from private sector sources, have a different target settings process than other metrics.
The targets are simply a rolling average of the previous three years, minus the band of tolerance.
SMA3’s Research funding & capacity: Federal Tri-Agency funding secured metric is a more sustainable target settings method for the zero-sum research revenue attracted from private sector sources metric measure because it is not structuring each university to consume the others portions as a mandate (though Tri-Agency funding itself remains competitive). SMA3 documents also provide the real dollar amounts separately from the historical data. Institutional research offices regularly provided this information publicly, including in reports to the Canadian Association of University Business Officers (CAUBO).
America PBF research metrics
Only a few American PBF programs have a similar metric, for example, Tennessee has a research, service, and sponsored programs metric, which is defined as the “expenditures on activities for research, service, or instruction. Financial aid, capital funding, state appropriations, donations from foundations, and practice income are excluded from this outcome” (Wilson et al., 2020, p. 9). Tennessee’s measure is more of a measure of nonteaching expenditure, not a measure of success in the institution’s research mission.
The literature on PBF programs in America examines the general impact of declining funds and the distorting impact of PBF metrics on teaching-related areas such as admissions but does not identify any effects on research beyond general impacts on budgets and activity.
European PBF research metrics
Europe has had different forms of performance-based research funding for some time, both for universities and for dedicated research institutions. The European Union’s 2011 policy document, Supporting Growth and Jobs—An agenda for the Modernisation of Europe’s Higher Education Systems (Directorate-General for Education and Culture, European Commission, 2011), has encouraged “a better identification of the real costs of higher education and research and the careful targeting of spending, including through funding mechanisms linked to performance which introduce an element of competition” (p. 13).
EU member states have implemented different forms of PBF for research in parallel and directly as part of PSE funding. These research PBF programs, in particular, the United Kingdom’s Research Excellence Framework have de-emphasized teaching and led to unintended negative consequences (Bishop, 2020).
Performance metrics and targets that measure and reward paper publications or citations have in some cases reduced the impact of the associated papers. This practice also can incentivize so-called “salami” style research publication; that is, slicing up the results of research in an attempt to increase the publications yielded from the same research (Jonkers & Zacharewicz, 2016).
What does this mean for University research?
By aggregating the Tri-Agency funding, there is less incentive for institutions to game the metric (research funding and capacity: Federal Tri-Agency funding secured) or alter institutional research strategies beyond factors that would otherwise be relevant to institutions with two notable exceptions:
- High-activity but low-cost research would be less recognized under this metric, although alternative metrics have different issues, as discussed in some of the European examples.
- Institutions that regularly participate in research that is externally funded would have an incentive to put greater emphasis on Tri-Agency funded research, if it was not for the research revenue attracted from private sector sources metric in SMA3.
Implementations of the research funding & capacity: Federal tri-agency funding secured metric
The average weighting for this metric is 13% in the first year and 8% in the subsequent years. The most often used weighting is 10% in the first year and 5% in the subsequent years. Université de Hearst does not participate in either research metric.
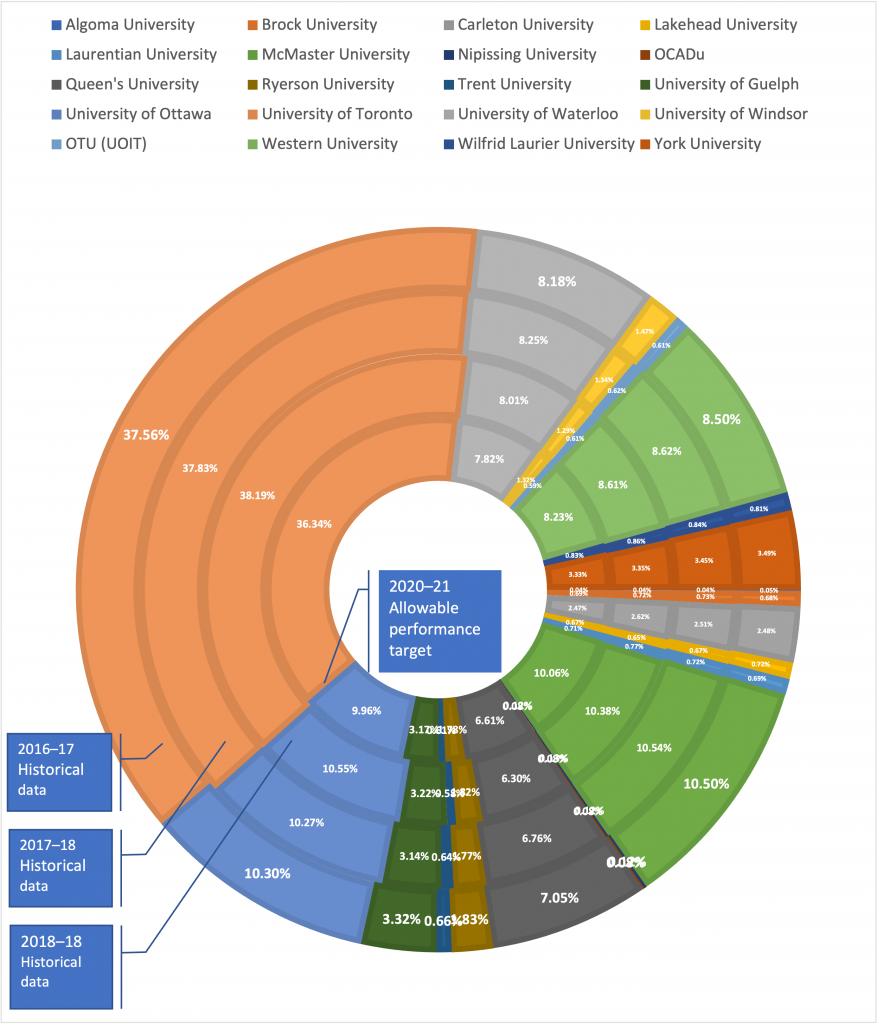
The total of all historical data adds up to 99.10% of all Tri-Agency funding allocated to Ontario in 2016–17, 98.94% in 2017–18, and 98.78% in 2019–20.
Presumably, the remainder for each year is awarded to other Ontario-based institutions such as colleges, hospitals, and private firms.
The allowable target for 2020–21 adds up to 95.43%.
The University of Toronto consistently represents over a third of Tri-Agency funding awarded in Ontario, reflecting the 16% that the University of Toronto is awarded nationally (University of Toronto & MCU, 2020, p. 16). This is an example of why an average-only target setting model is more appropriate to this metric, as the University of Toronto’s or Queen’s University’s variances would set targets that would consume Algoma’s share within two years.
Institutional narratives described the research activity at each institution, alignment to strategic plans, and institutional success in rankings in publications that ranged from Maclean’s, to The Times Higher Education, to Research Infosource rankings, to Nobel prizes.
McMaster University, the University of Toronto, the University of Waterloo, and Western University all weighed this metric highly, with Western University weighting consistently at the maximum available. These institutions cited constancy as the primary reason for the weighting allocation. Carleton University weights all dynamic metrics at 11%. All other universities weighted the metric at the lowest possible weight, with Laurentian University providing insight into its weight that “Laurentian has been able to attract Tri-Agency funding; however, we are concerned about the volatility of this metric given our connections to resource-based industries, including mining” (MCU & Laurentian University, 2020, para. 97).

Tabular version of Tri-Council funding
| University | 2016–17 Historical data | 2017–18 Historical data | 2018–19 Historical data | 2020–21 Allowable performance target | Average (calculated) |
|---|---|---|---|---|---|
| Algoma University | 0.05% | 0.04% | 0.04% | 0.04% | 0.04% |
| Brock University | 0.68% | 0.73% | 0.72% | 0.69% | 0.71% |
| Carleton University | 2.48% | 2.51% | 2.62% | 2.47% | 2.54% |
| Lakehead University | 0.72% | 0.67% | 0.65% | 0.67% | 0.68% |
| Laurentian University | 0.69% | 0.72% | 0.77% | 0.71% | 0.73% |
| McMaster University | 10.50% | 10.54% | 10.38% | 10.06% | 10.47% |
| Nipissing University | 0.12% | 0.12% | 0.13% | 0.12% | 0.12% |
| OCADu | 0.08% | 0.08% | 0.08% | 0.08% | 0.08% |
| Queen's University | 7.05% | 6.76% | 6.30% | 6.61% | 6.70% |
| Ryerson University | 1.83% | 1.77% | 1.82% | 1.78% | 1.81% |
| Trent University | 0.66% | 0.64% | 0.58% | 0.61% | 0.63% |
| Université de Hearst | |||||
| University of Guelph | 3.32% | 3.14% | 3.22% | 3.17% | 3.23% |
| University of Ottawa | 10.30% | 10.27% | 10.55% | 9.96% | 10.37% |
| University of Toronto | 37.56% | 37.83% | 38.19% | 36.34% | 37.86% |
| University of Waterloo | 8.18% | 8.25% | 8.01% | 7.82% | 8.15% |
| University of Windsor | 1.47% | 1.34% | 1.29% | 1.32% | 1.37% |
| OTU (UOIT) | 0.61% | 0.62% | 0.61% | 0.59% | 0.61% |
| Western University | 8.50% | 8.62% | 8.61% | 8.23% | 8.58% |
| Wilfrid Laurier University | 0.81% | 0.84% | 0.86% | 0.83% | 0.84% |
| York University | 3.49% | 3.45% | 3.35% | 3.33% | 3.43% |
Bishop, Dorothy. “Now Is a Good Time for the UK to Ditch the REF and the TEF.” Times Higher Education (THE) (blog), March 24, 2020. https://www.timeshighereducation.com/blog/now-good-time-uk-ditch-ref-and-tef.
Directorate-General for Education and Culture, European Commission. Supporting Growth and Jobs : An Agenda for the Modernisation of Europe’s Higher Education Systems: Communication from the Commission to the European Parliament, the Council, the European Economic and Social Committee and the Committee of the Regions. LU: Publications Office, 2011. https://data.europa.eu/doi/10.2766/17689.
Jonkers, Koen, and Thomas Zacharewicz. “Research Performance Based Funding Systems: A Comparative Assessment,” 2016. https://ec.europa.eu/jrc/en/publication/eur-scientific-and-technical-research-reports/research-performance-based-funding-systems-comparative-assessment.
Ontario Ministry of Colleges and Universities, and Laurentian University. “2020-2025 Strategic Mandate Agreement: Laurentian University.” Ontario.ca, September 14, 2020. https://www.ontario.ca/page/2020-2025-strategic-mandate-agreement-laurentian-university.
University of Toronto, and Ontario Ministry of Colleges and Universities. “2020-2025 Strategic Mandate Agreement: University of Toronto [PDF],” 2020. https://www.utoronto.ca/sites/default/files/Toronto%20-%20SMA3%20Agreement%20-%20August%2031%2C%202020%20SIGNED%20FINAL_0.pdf.
Wilson, Justin P., Kristina Podesta, and Anna Johnson. “An Explanation of the Outcomes-Based Funding Formula (2015-2020).” Office of research and education accountability, Tennessee comptroller of the treasury, November 2020. https://comptroller.tn.gov/content/dam/cot/orea/advanced-search/2020/OBFprimer.pdf.

")


